Setting Up Reports
Learn how to produce various Reports for your form data
The 'Reports' heading allows the form creator to produce various reports on the data input from the form entries. The reports can be displayed in different charts to analyse the data gathered, or individual entries can be browsed and checked individually.
Exporting Reports in Excel - Blank Download
If you are running the latest versions of Microsoft Excel and recently had an automatic upgrade from Microsoft, you may experience a problem in downloading results to Excel, which causes an apparently blank download with no error message displayed.
This problem has been brought on by a Microsoft patch which was released in July.
Microsoft made a change in the behavior of certain file types to increase security. This change came in the security updates KB3115262, KB3170008, and KB3115322. Previously, when you tried to open an HTML or XLA file with an .XLS file extension from an untrusted location, Excel would warn about the mismatch between the file extension and content, but would still open the workbook without Protected View security. After the security up
To get around this problem you have two options:
- Download and save as a .csv file and open in Excel.
OR:
- Download and save as a a .xls file, then right mouse click the file, select 'Properties', and then select 'Unblock' next to the 'This file came from another computer and might be blocked to help protect this computer.' warning pop-up message. After doing this, the file can be opened as before.
Exporting Reports in Excel - Error Message
When downloading reports to an Excel spreadsheet, you may encounter an unusual message pop-up. The message you are receiving is expected:
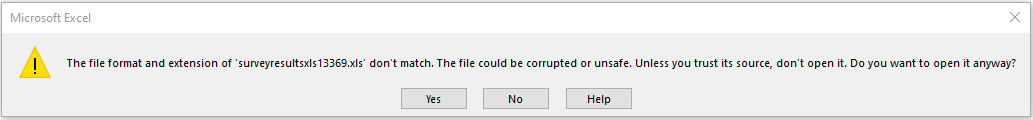
This behaviour is caused by a Microsoft Excel security update which provides a warning on excel files created from web pages. The downloaded files can still be opened after a warning message is clicked.
The following statement from Microsoft explains the reasoning behind this pop-up message:
'The security update changed how Excel handles documents that are opened from untrusted locations (such the Internet zone) which are not supported in Protected View, such as HTML/XML/XLA files. Opening them without Protected View is a security vulnerability, and therefore files open from such locations are now blocked. We realize this breaks compatibility with some existing solutions, and are working on getting these file types supported with Protected View. Until that happens, form respondents will need to manually trust the file before they open them in Excel, as demonstrated in one of the workaround suggestions. Excel can still open these files without an issue if they are trusted.'
Report Setup
The 'Report Setup' sub-heading is the hub for editing the display options for questions within the other report options.

All of the questions listed in your form are displayed within the table. The table columns allow for editing of a specific question aspect for the reports.
- Question: Displays the question text.
- Type: Displays the question type.
- Display: Select whether the question is displayed in the reports.
- Responses: Total number of responses the question has had with data entered.
- Views: Total number of times the question has been viewed.
- View Chart: Displays the chart for the specific question that has been setup, or the text from an 'Open' question. This is essentially a preview for the changes made within the 'Edit Chart' option.
The 'Edit Chart' column allows for the individual editing of how a question is displayed within the reports. To see the a preview of the changes made for a question, click on the 'View Chart' icon.
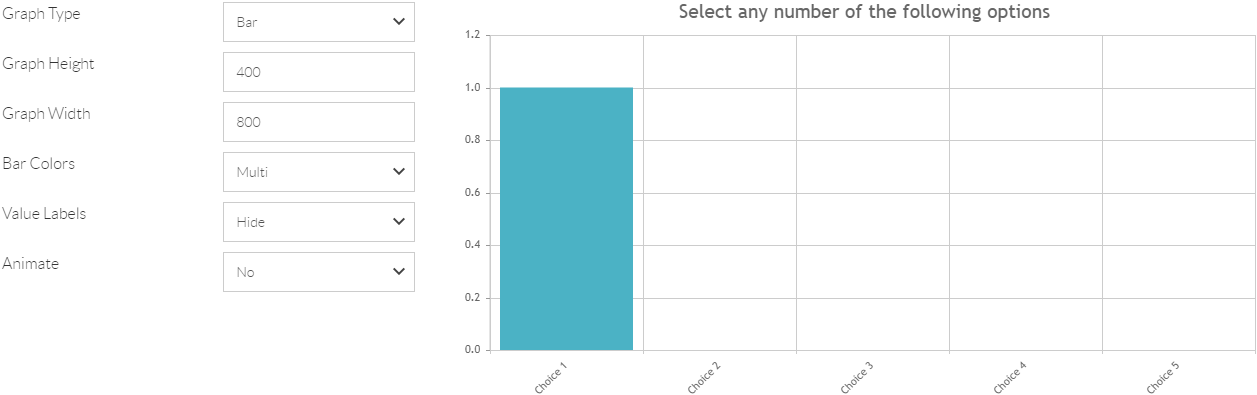
The left hand side will display the various settings options, and the right hand side will display a preview of the graph once the 'Save' button is clicked after applying changes. Edit the following settings for your report:
- Graph Type: Select what type of graph the question is presented in. Select between Bar, Horizontal Bar, Donut or Pie.
- Graph Height: Edit the height of the graph (Only available for Bar charts).
- Graph Width: Edit the width of the graph (Only available for Bar charts).
- Bar Colors: Edit the bar colours between multi or singular coloured. The default single colour is blue.
- Value Labels: Show or hide the display of the number of total responses to each choice on the graph.
- Animate: Enable the animation of the graph type selected.
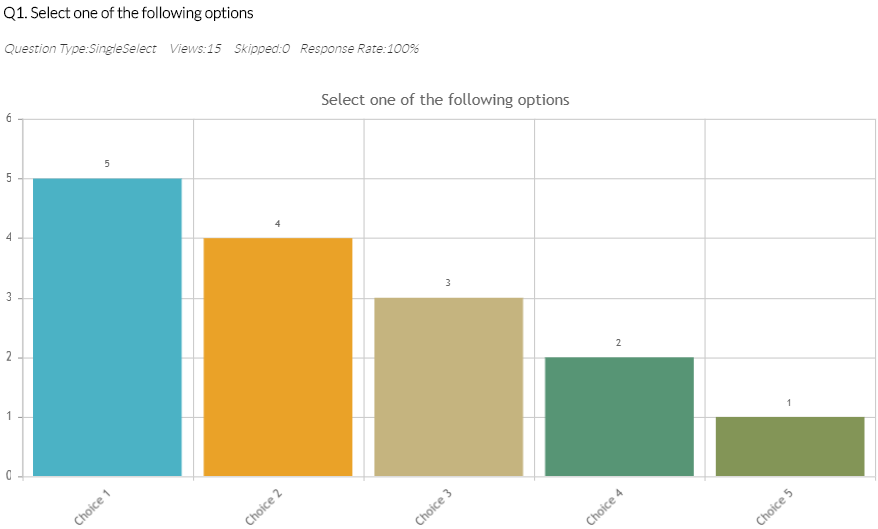
Graph Types
Bar Chart
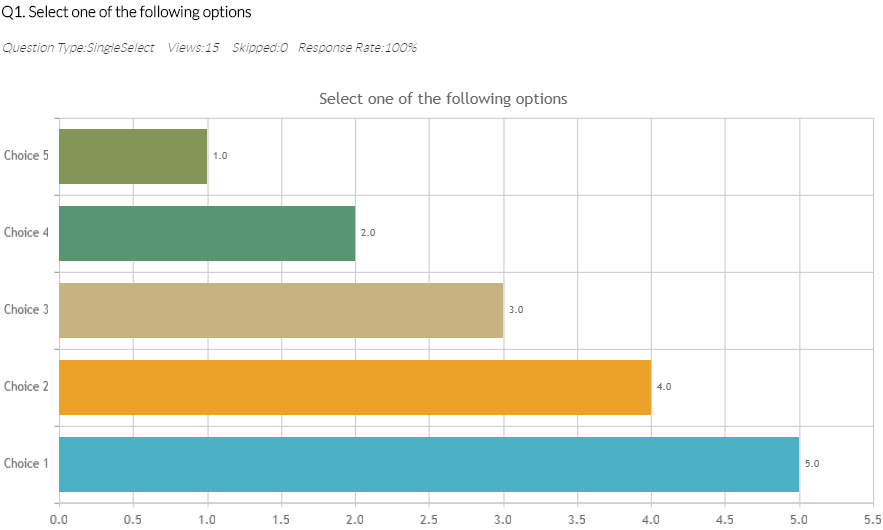
Horizontal Bar Chart
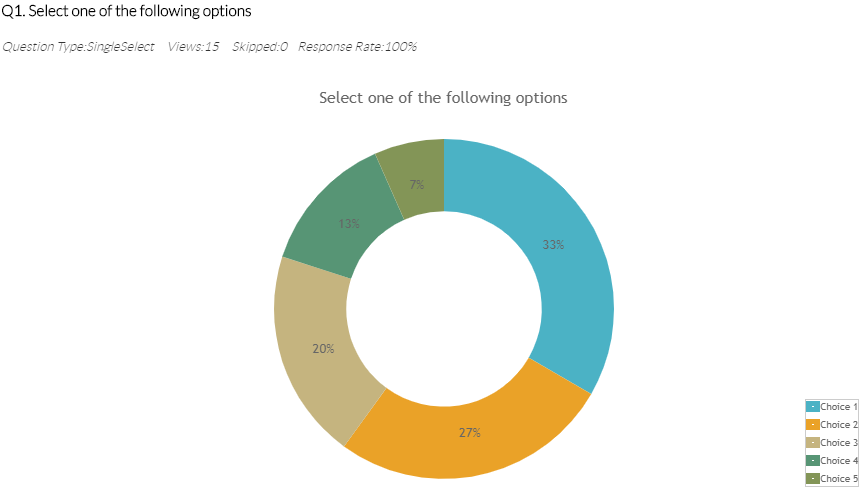
Donut Chart
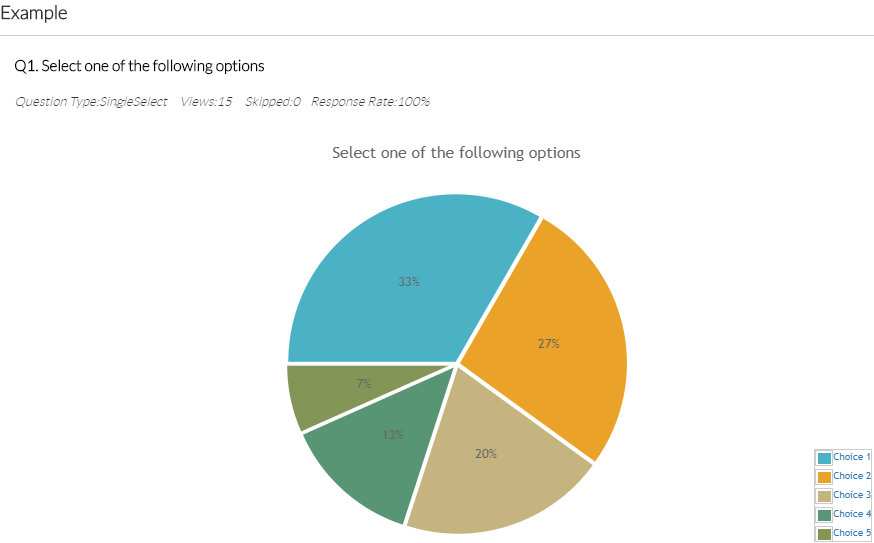
Pie Chart
Set Filter
The 'Set Filter' sub-heading can be used to filter out specific entry question answers, to group together responses for organisation purposes. This allows you to attach certain filter conditions to questions so that reports only include records that match the filter conditions. When a filter is produced, it will edit the display of the 'Summary Report'.
Select the questions you would like to use to filter the results. You may include or omit already selected questions by checking or unchecking the enabled box. Each Filter may be logically joined by selecting 'AND' or 'OR' options.
For example: Within your form, you could set up two questions prior to the rest of the questions within your form to identify a specific group of people.
Your fist question in your form could ask the respondent for their nationality and provide the answer choices: Scottish, English , Irish, Welsh
Your second question in your form could ask the respondent for their age group and provide the answer choices: 18-25, 26-35, 36-49, 50+
The filter could then be set to only return form entries and produce results for the rest of the survey that was answered by respondents who are Scottish and between 18-25 years old.
See Also