Power BI
Incorporate your forms data with Power BI
Power BI Incorporation
The use of the Power BI visualisation options with forms data collection can produce a series of insightful reports to enhance your findings. By using the different output options to either an Excel spreadsheet or .CSV file, data can be extracted from the original form and advanced visuals such as a world map, scatter chart and more can be used in conjunction. Live forms can be included within the reports with frequently updated real time data.
- Today we can off-line map Formwize collected (CSV or API JSON) data (fields) into Power BI and publish to the web
- Tomorrow we can live map Formwize collected data via API JSON into Power BI report servers to publish to the web live
The Power BI report page can be embedded within a different web page, but this action will require a 'Pro' account within Power BI. For more information on how to upgrade your Power BI account plan, go to the Microsoft website. Please click here.
Example Dashboard
Here is an example of how you can utilise Power BI dashboards with your forms data:
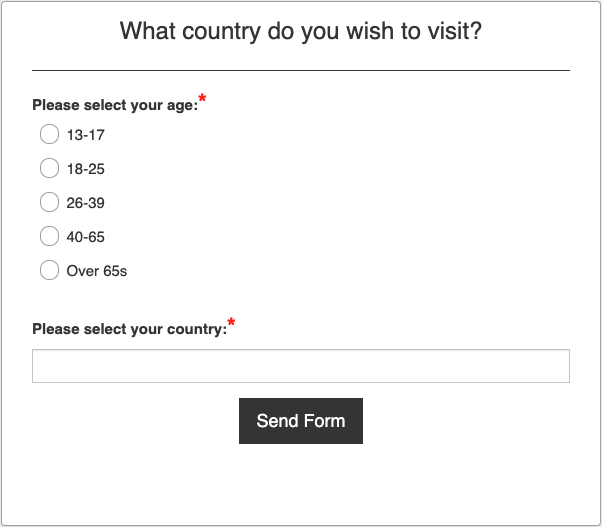
To create a dashboard with form data, you need to set up your form to extract the entries. You can create a dashbaord for any type of form. This example below is based off a form that collects data of a persons age and the country they wish to visit in the future. The form consists of a 'SingleSelect' and 'DropDownSelect' question type.
Click here for an example form that was set up to use within a Power BI dashboard:
A simple two question form can produce a detailed dashboard as seen here:
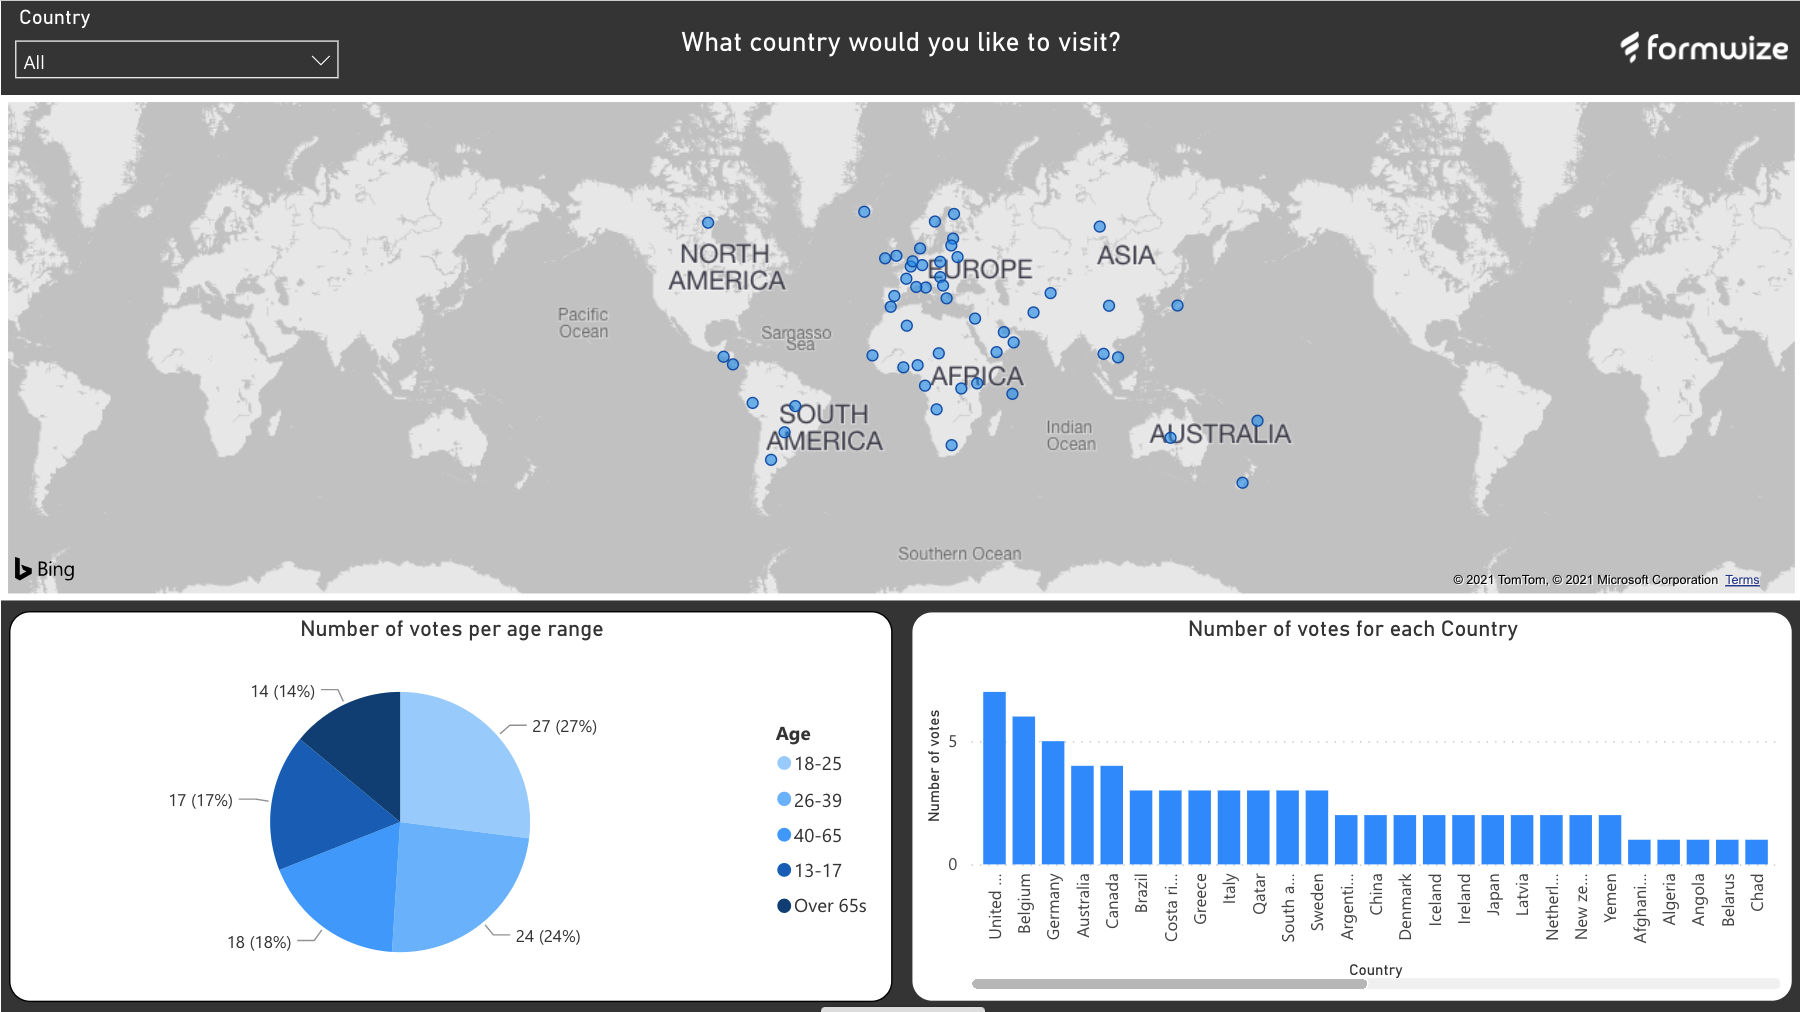
This dashboard displays the data collected from 100 form entries. Each individual graph on the dashboard is labelled and displays different data such as the most popular age group that took part in the survey ( see the bottom left pie chart ) and the different geographical locations that were selected by the form respondents ( see the map at the top of the dashbaord ). This dashboard is fully customisable and your own branding and skin can be applied.
Another similar example of how you can display your form data using a Power BI dashboard can be seen here. This use case is to evaluate and grade a company graduates performance in the past working year.
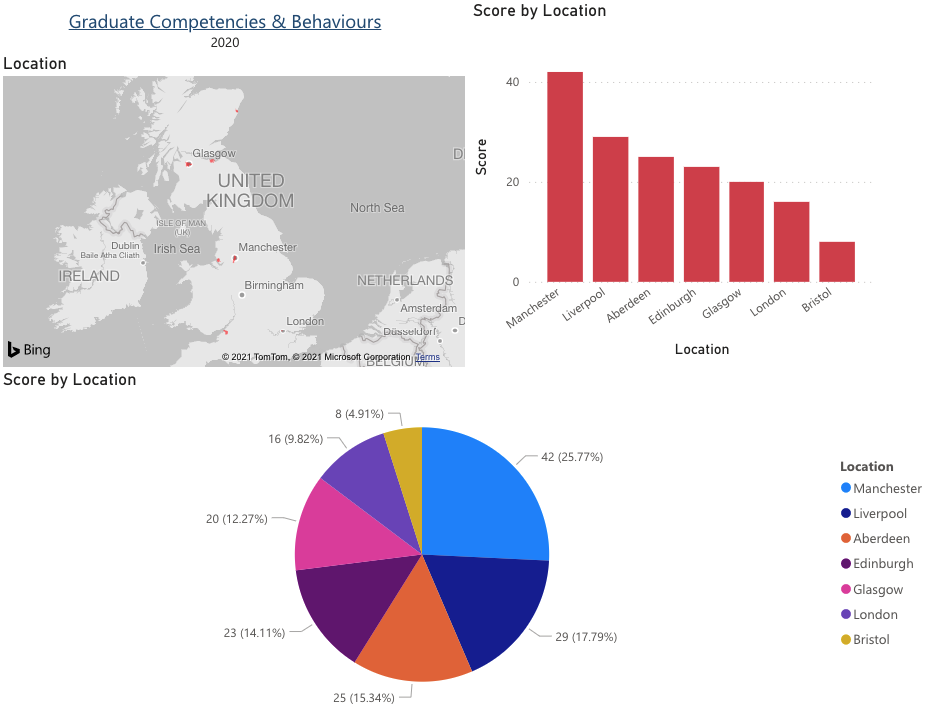
The form will collect data on each individual graduate and display the overall scores by geographical location. For example, this company has multiple graduates across the U.K. and in the top right bar chart you can see that the Manchester graduates received the highest score out of the class. The pie chart at the bottom of the dashboard provides a better insight on the exact scores that each locational graduate received.